This article will describe how to use the available graph options in Agrimaster.
There are currently 3 graphs available.
- Budget Comparison.
- Bank Balances.
- Performance Charts.
To access all graphs:
- From the Home Page.

- Click on Cashbook Reports.

- Click on Graphing.

- Select one of the graph buttons.

Budget Comparison Graph
To use this you need to have a current budget saved.
- Click on the Budget Comparison Graph button.

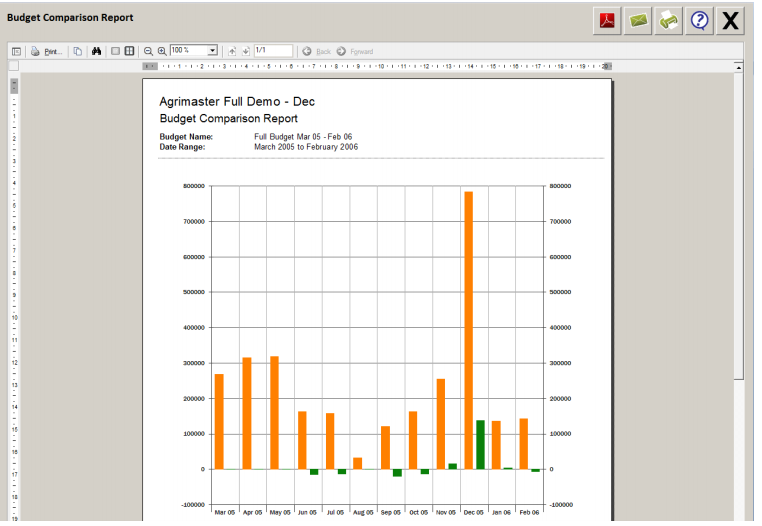
- Setup the report.
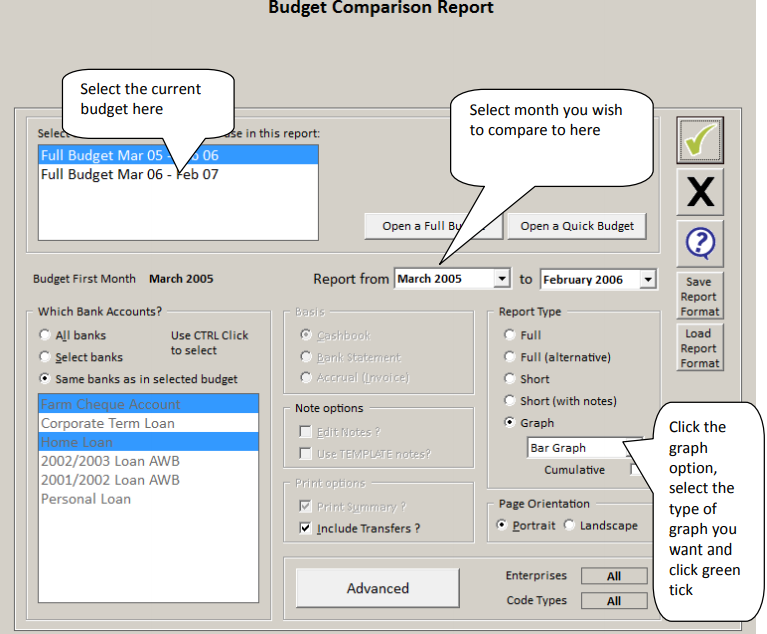
- You can print the report by clicking on the Print icon.
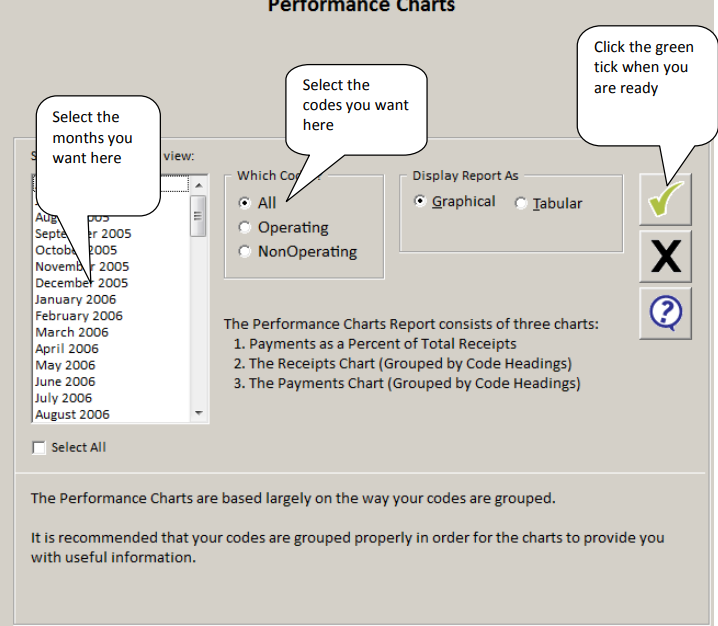
Performance Charts Graph
The data to create this graph comes from the data you have entered in your cashbook, including codes and enterprises.
- Click on the Performance Charts button.

- Setup the report.
- The reports will look something like this:
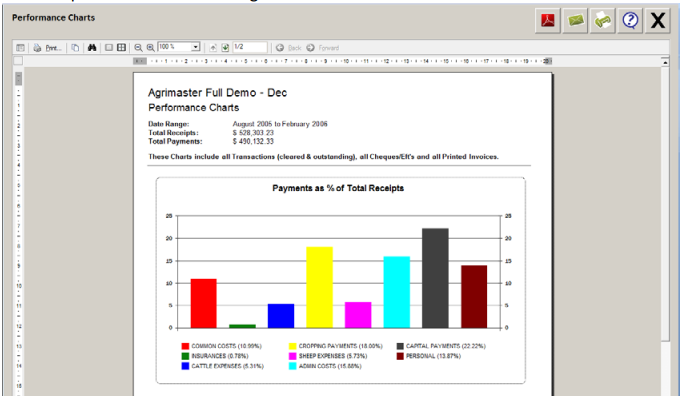
- When you see a blue underlined word (hyperlink) you can click on it for more details.
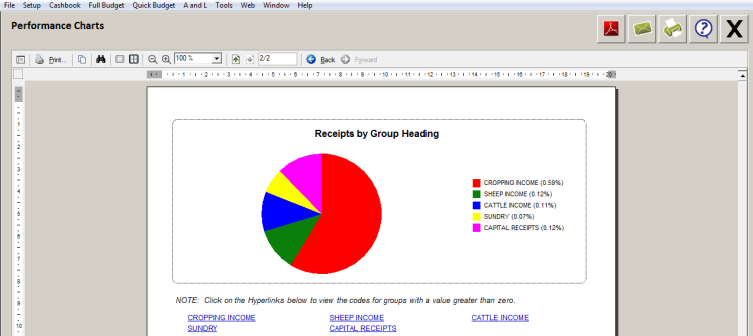
- You can print the report by clicking on the Print icon.
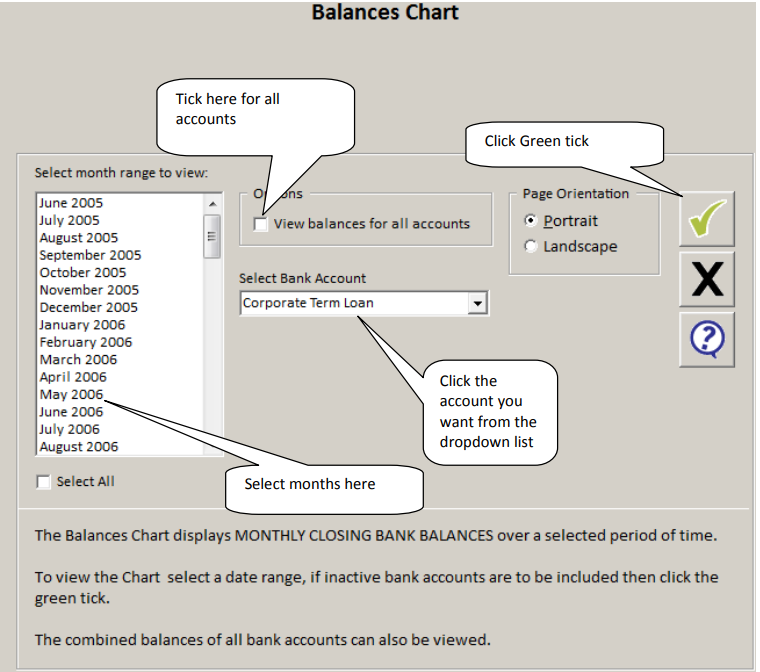
Bank Balances Graph
The data to create this graph comes from your reconciliations and monthly reports.
- Click on the Bank Balances button.

- Choose either one bank account to view the balances or all bank accounts.
- The reports will look like this:
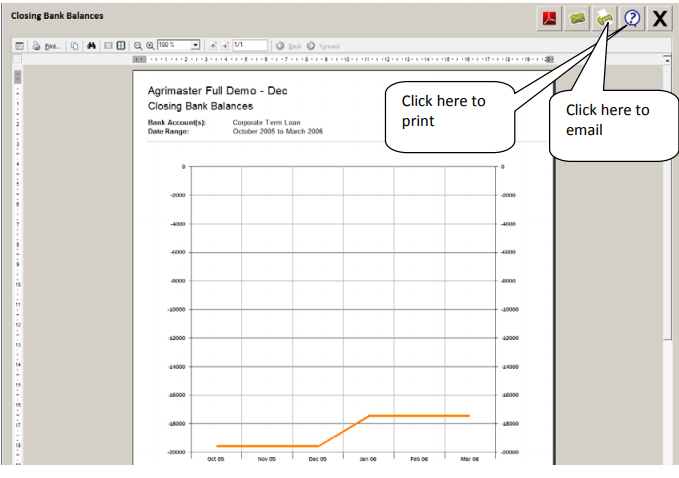
- You can print the report by clicking on the Printer icon,
- Clicking the black cross will return you to the graph setup window.
Comments